
Production System
Audit
Two days at your plant —
a clear picture of losses, priorities and a ready action plan
Not a report for the shelf, but a working tool for decisions
and report preparation
on site
levels
elements
week of analysis
and report preparation
days
on site
maturity
levels
assessment
elements
DIAGNOSTICS
Sound familiar?
You are planning growth, but you understand that doubling volume with today’s processes means doubling the chaos. Equipment stands idle, deadlines slip, complaints repeat — and there is no precise data on where exactly the money is leaking.
Intuition says one thing, the financial report another, and the shop floor a third.
EVERY MONTH WITHOUT A SYSTEMATIC DIAGNOSIS means
downtime, defects, excess stock and operations that create no value. This is money your company is losing right now.
- “We want to grow, but our processes aren't ready”
Scaling immature processes multiplies problems, not profit.
First, a systematic diagnosis.
- “We are losing money but don't know where”
Departments work in silos and blame each other.
Without an objective picture, it is impossible to make the right decision.
- “We are afraid of one more report for the shelf”
A BPI Group audit ends not with general recommendations but with a prioritized action plan with specific steps and deadlines.
THE SOLUTION
What a production system audit is
A structured assessment of the organization’s maturity across nine key elements — from process standardization to quality management and a culture of continuous improvement. Over two days, a team of BPI Group practitioners works directly at your plant: observing processes, analyzing data and talking to people at every level, from operators to managers.
The result is not a set of abstract recommendations but a diagnosis with concrete figures, a visual maturity profile and a prioritized action plan you can start working with the next day.

METHODOLOGY
What exactly we assess
The methodology covers nine elements that together make up a production system — from operations standardization to a culture of improvement and people development.
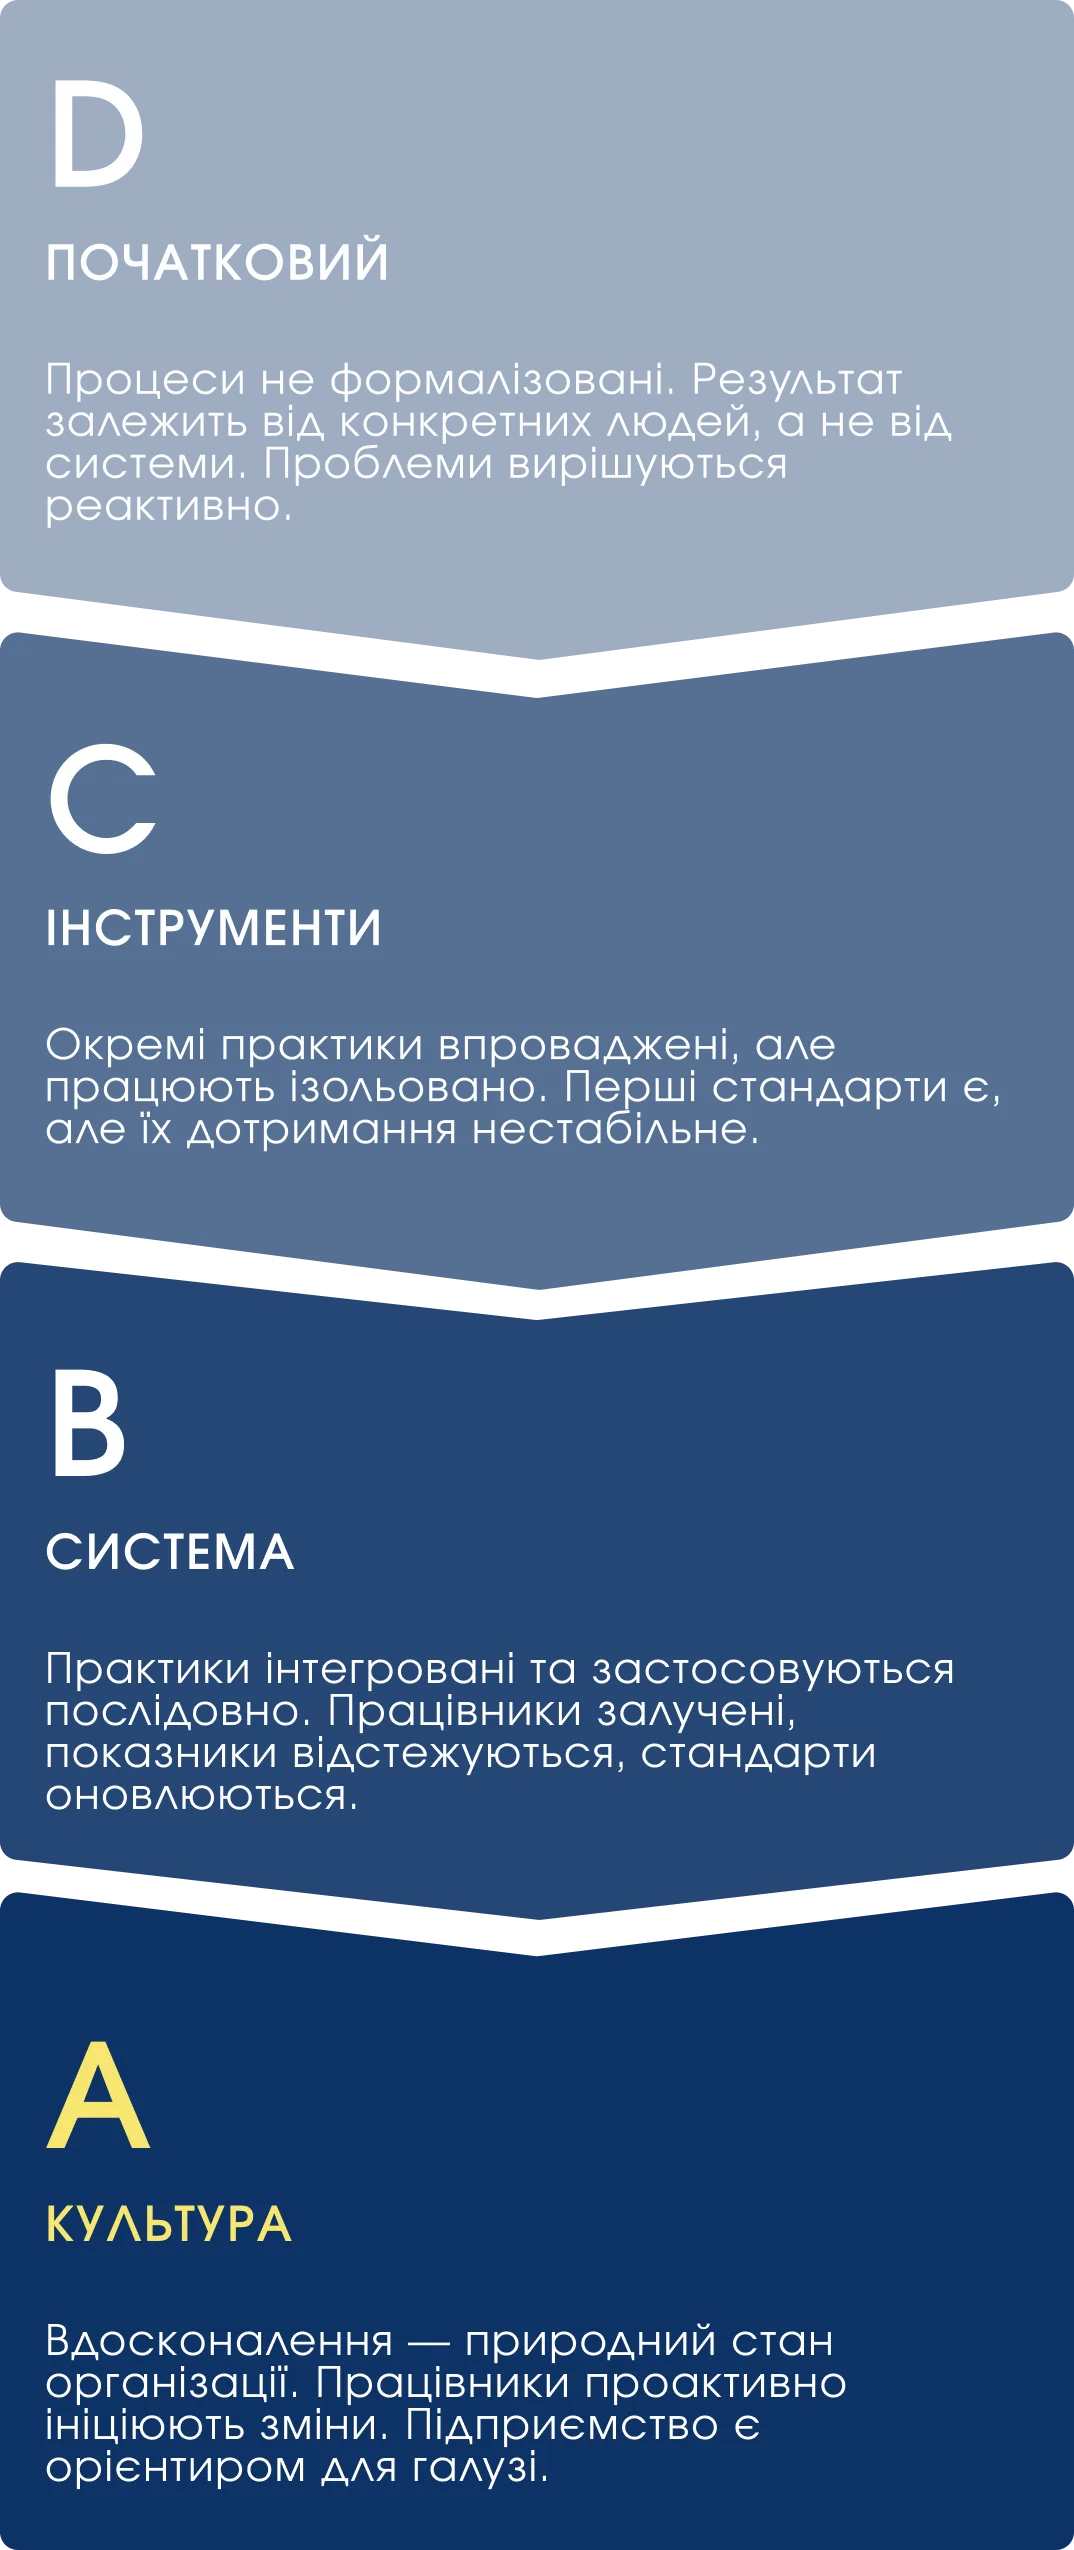
Each is rated on a four-level maturity scale (D → A) based on actual observations, interviews and working documents.
- Production standardization
Are operations performed the same way regardless of shift and operator?
We assess work instructions and SOPs, their availability in the work area, workplace organization under 5S, visual management, floor marking and the integration of safety requirements.
Where there is no standard, deviations cannot be seen.
SOP
5S
Visual management
- Flow management
Does the product move through production without unnecessary stops and queues?
We build a value stream map (VSM) and assess takt, operation balancing, the pull system and kanban, buffer limits and the level of work in progress.
Overproduction and waiting are the two biggest hidden losses.
VSM
Kanban
Pull system
- Maintenance and equipment management
Does the equipment work when needed, at the productivity it is capable of?
We assess autonomous and planned maintenance under TPM, the planned preventive maintenance (PPM) system, equipment classification by criticality, breakdown data collection and changeover speed under SMED.
Every unplanned stop means lost orders.
TPM
SMED
PPM
- Maintenance and equipment management
We assess autonomous and planned maintenance under TPM, the planned preventive maintenance (PPM) system, equipment classification by criticality, breakdown data collection and changeover speed under SMED.
Every unplanned stop means lost orders.
- Quality assurance
We assess the control of critical parameters at every stage, statistical process control, error-proofing systems and how production responds to detected defects.
The cost of a defect grows tenfold at each subsequent stage.
- Quality assurance
Is quality built into the process, or caught at the end?
We assess the control of critical parameters at every stage, statistical process control, error-proofing systems and how production responds to detected defects.
The cost of a defect grows tenfold at each subsequent stage.
Built-in quality
Poka-yoke
SPC
- Performance management
Does every level of the organization know its goals and current status?
We assess the cascading of goals down to the team level, the display of indicators on information centers, the structure of production meetings, and escalation and feedback mechanisms.
Without transparency, problems stay invisible until they become critical.
KPI
Information centers
Performance management
- Organization management
Is it clear to every employee what they are responsible for and how it relates to the strategy?
We assess the distribution of roles and responsibilities, the organization of production teams, their participation in improving their own area, and the regularity of work meetings.
Where roles are not defined, the problem belongs to no one.
Teamwork
Organizational structure
Responsibility matrix
- Continuous improvement
Is there an algorithm for working with a problem, or does everything come down to firefighting?
We assess the use of root cause methods — A3, FMEA, “5 Whys”, the Ishikawa diagram — the work of project teams and the register of focused improvements for each area.
A problem closed without a root cause comes back next month.
A3
FMEA
5 Whys
- Kaizen culture
Does a culture of improvement really work, or is it only declared?
We assess the suggestion system and an idea’s path from submission to implementation, the author’s involvement in implementation, leadership routines and managers’ gemba walks, the level of trust between levels, and occupational safety practice.
The difference between level D and level A is the difference between slogans on the walls and daily practice.
Kaizen
Suggestion system
Gemba walks
- Training and personnel development
Do people's skills grow faster than the processes become more complex?
We assess the onboarding program for new hires, skills matrices, mentoring, individual development plans and how regularly operators’ skills are checked on each process.
An organization that does not develop its people systematically depends on individuals — and that is a risk.
Skills matrices
Mentoring
Onboarding
The nine elements are grouped into four areas that form the overall maturity profile: flow and standardization, performance, quality, culture and people.
ASSESSMENT SCALE
Four maturity levels
The scale lets you pinpoint exactly where you are today and what it takes to reach the next level.

AUDIT RESULT
What you get
An objective, fact-based assessment
An independent diagnosis of each of the nine elements with a maturity level determined. Instead of arguments between departments — a single picture.
A visual maturity profile
A radar chart that shows strengths and gaps in thirty seconds. A tool for comparing progress year over year.
Impact-based priorities
An effort–result matrix: focusing resources on 3–5 areas that will deliver 70–80% of the total effect.
A development roadmap
A step-by-step transition plan for each priority element. Specific actions, deadlines and success criteria over a 1–3 year horizon.
Gap and potential analysis
A description of the target state compared with the current one. You see not only the problems but also a concrete picture of how the system should work.
A shared understanding for the team
One language for discussing problems and one frame of reference for decisions. When everyone sees the same picture, the speed of change multiplies.
ABOUT US
Why BPI Group
We know both practice and theory
Our team of auditors are consultants who have spent hundreds of days on production sites. We know the difference between what is written in the procedure and what happens on the shop floor.
Licensed Shingo Institute affiliate
BPI Group is the only licensed partner of the Shingo Institute (USA) in Ukraine, an international center of excellence in operational management.
Dozens of projects across industries
From food processing to mechanical engineering — the methodology has been adapted and proven at companies of different specifics and scale.
Results, not process
Every audit ends with a concrete action plan. We support implementation and are accountable for the practical applicability of every conclusion.
AUDIT RESULT
Client cases
Packaging production
Scaling
without chaos
Situation
The company planned to expand capacity, but its existing processes did not ensure stable quality or predictable lead times.
THE SOLUTION
The audit revealed critical gaps in performance management and maintenance. The focus went to daily management and preventive maintenance.
RESULT
Unplanned downtime reduced by 15%, order lead time cut by 25%.
Mechanical engineering
From chaos
to profit
Situation
Order growth led not to profit growth but to more chaos: cycles lengthened, inventories grew, defects repeated.
THE SOLUTION
The audit showed level D in flow management and continuous improvement. The priority was a pull system and structured problem solving.
RESULT
Work in progress reduced by 50%, On Time In Full improved by 60%. Payback — 5 months.
FMCG
Stability
in peak season
Situation
High seasonality: a shortage of people at the peak, overproduction in the off-season, unstable quality when staff change.
THE SOLUTION
The root causes were a low level of operations standardization (D) and the lack of systematic organization management (C). The focus went to SOPs, quick changeovers and fast training.
RESULT
Onboarding time dropped from 8 weeks to 1. Peak-season quality matched stable periods.
Process
How the audit works
before the visit

1. PREPARATION
We agree on goals, collect basic information and identify key participants. From you — two or three short calls.


2 days
2. Work at your plant
Observing processes, studying documentation, structured interviews. Production runs as usual.
1 week

3. Analysis and report
Building the maturity profile, forming the priority matrix, developing the improvement roadmap.
2–3 hours
4. Presentation
A personal presentation to the management team: results, priorities, answers to questions, next steps.
Find out
where your company loses the most
Fill in the form — we will contact you within one business day, discuss your situation and answer your questions about the audit.
The conversation commits you to nothing